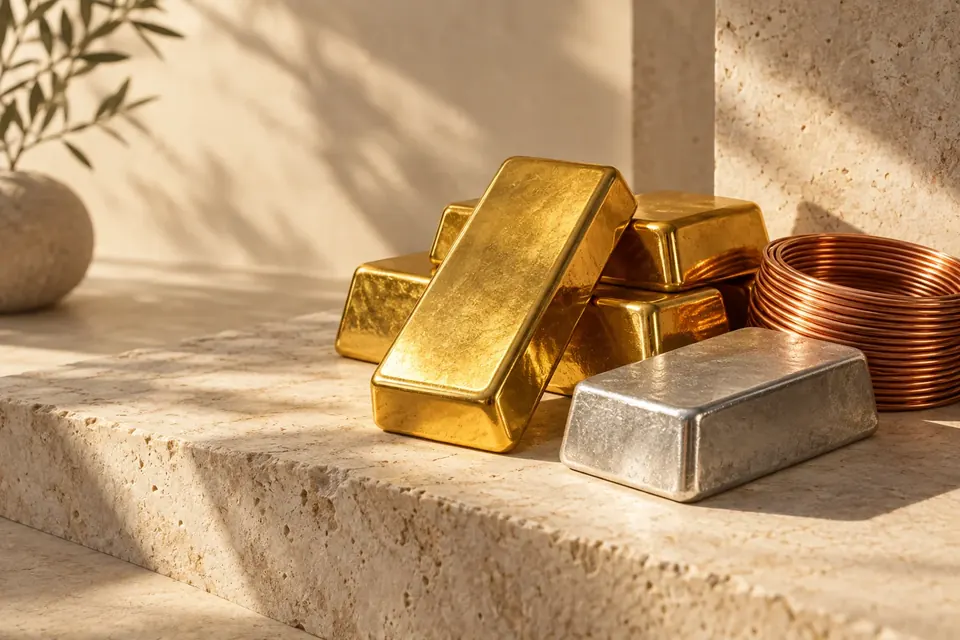
The gold–silver ratio is the gold price divided by the silver price, using the same currency, weight unit and observation period. It expresses how many units of silver have the same reference value as one unit of gold.
Keep the inputs aligned
At hypothetical prices of USD 3,000 and USD 30 per troy ounce, the ratio is 100. Dividing gold per ounce by silver per kilogram would give a meaningless result. The same problem arises when one price is an intraday quote and the other is last month's average.
Our ratio chart aligns observations of the selected frequency shared by both series. In monthly mode it divides the monthly gold average by the monthly silver average. This is not the same as averaging every daily ratio within that month.
Why the ratio changes
Gold and silver have different mixes of industrial and investment demand, different mine supply and different market sizes. A rising ratio means gold became more expensive relative to silver over the measured period; it does not prove either metal rose in absolute price.
No universal fair value
A historical average depends on the dates included. Changes in technology, monetary arrangements and market structure can affect long comparisons. A high ratio alone cannot establish that silver is cheap, or that a reversal must happen soon. Transactions also introduce spreads, fees, storage and tax considerations. The gold–silver ratio calculator lets you add those spreads to your own prices, and the gold vs silver comparison shows how the two moved over time.
Currency usually cancels out
If both prices are converted with exactly the same exchange rate, the common multiplier cancels in the division. If rates or timestamps differ, an artificial gap can appear. price-chart.com calculates this ratio directly from the aligned USD observations.
Test yourself. Check what you learned with the precious metals essentials quiz: 5 quick questions, each with a short explanation.
Sources & further reading
Educational reference. How we create and review our content.